Initializing Sensors
STEP 1: Install NIDS Tools
1. Install Zeek
Logstash needs to be installed before installing Zeek.
-
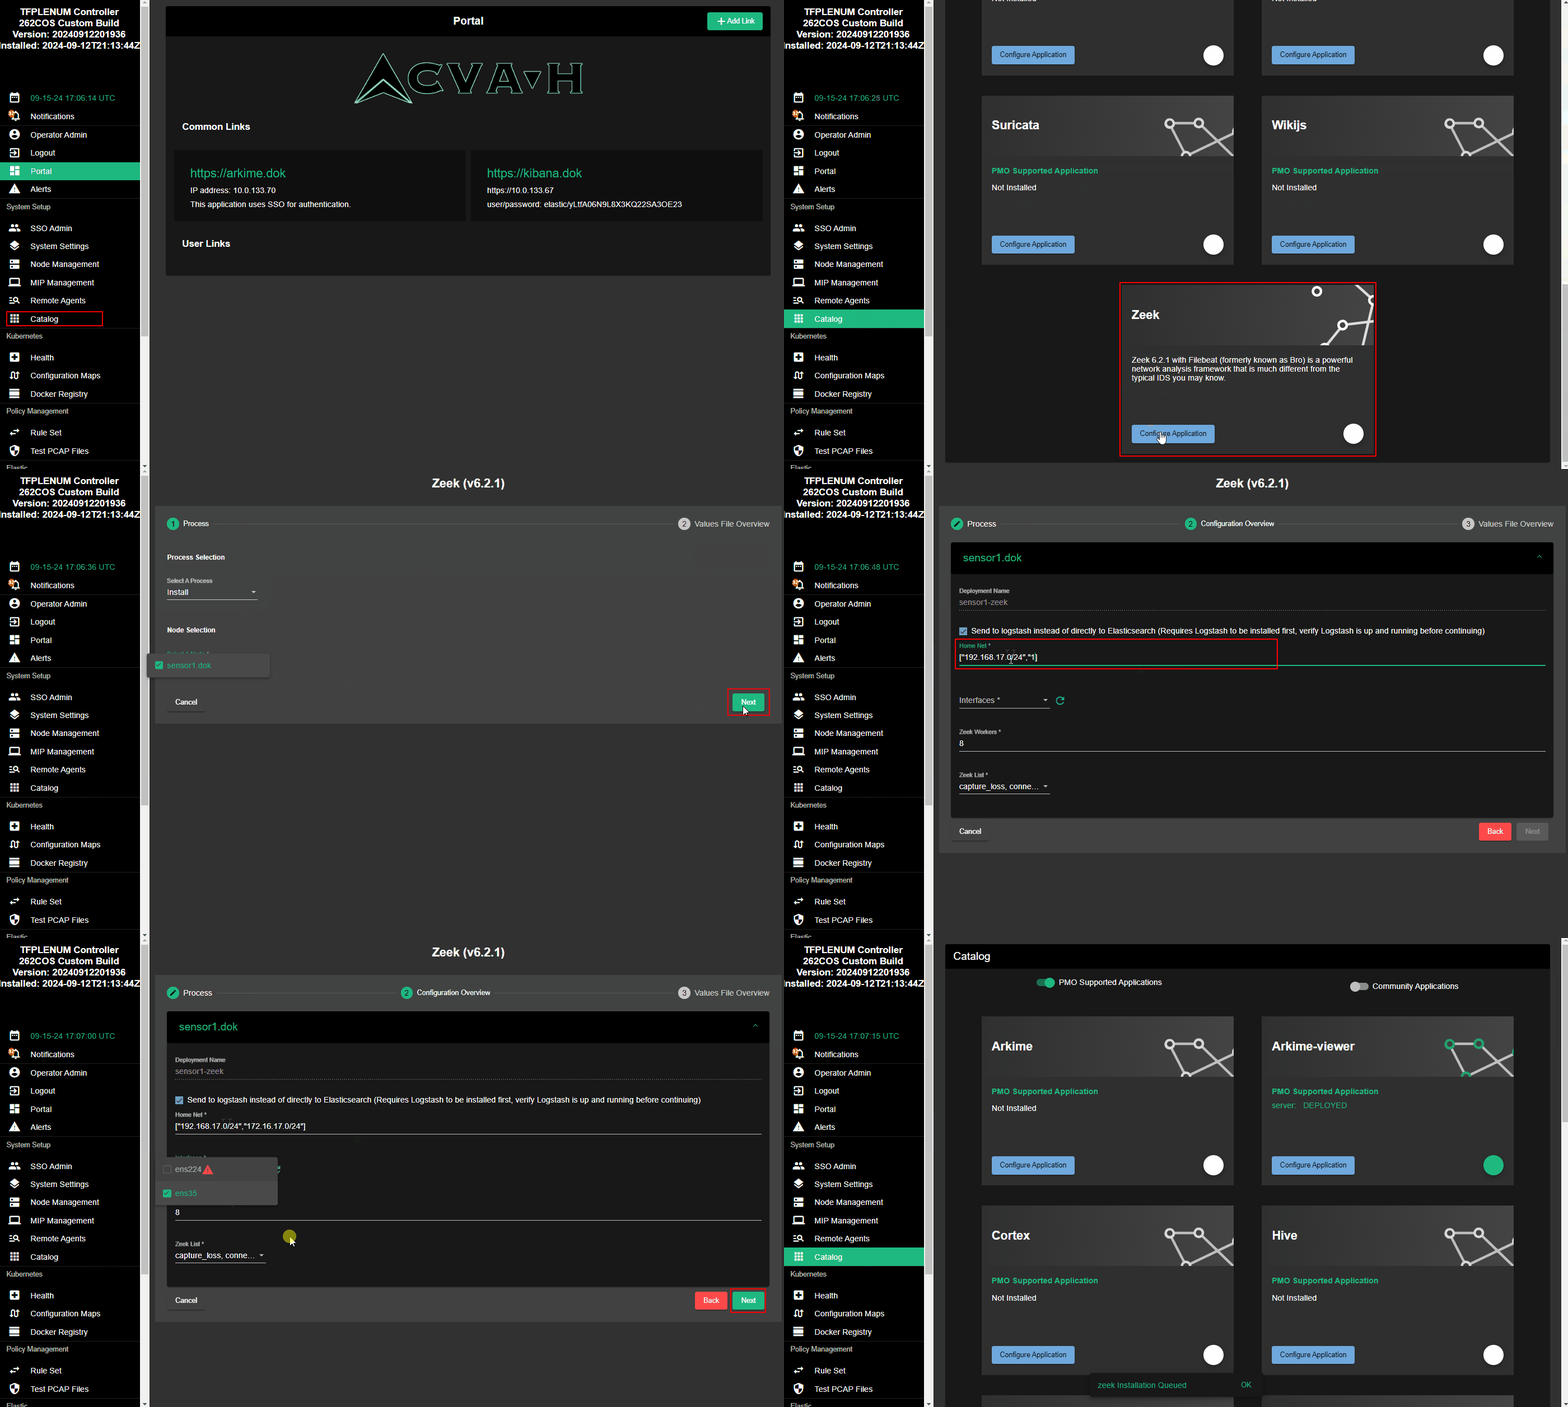
Browse to the TFPlenum Controller UI page
-
On the left navigation bar, click the Catalog link
-
Click the Configure Application button on the Zeek tile (a wizard will appear)
-
Click the Select A Process drop-down and select the Install option
-
Click Select A Node drop-down
NOTE: All configured sensors will have checkboxes next to them; select all sensors and then click Next
-
In Configuration Overview fill out the following fields for each sensor selected in the previous step
- Configure the
Home Netfield (set this to["192.168.0.0/16","172.16.0.0/12","10.0.0.0/8"]unless DAL info has been given by the requestor/MEL) - Select Interfaces drop-down (All connected network interfaces except management will appear with checkboxes)
- Select all the network interfaces monitoring traffic (i.e., Network Interfaces cards plugged into a mission partner network either through fiber or copper)
- Leave the Zeek Workers field set to
8unless the sensor it is being installed on does not have enough CPU cores (8) to support the Zeek processes - Before clicking the Next button, ensure the following option is enabled:
🗹 Send to logstash instead of directly to Elasticsearch
- Configure the
2. Install Suricata
Logstash needs to be installed before installing Suricata.
-
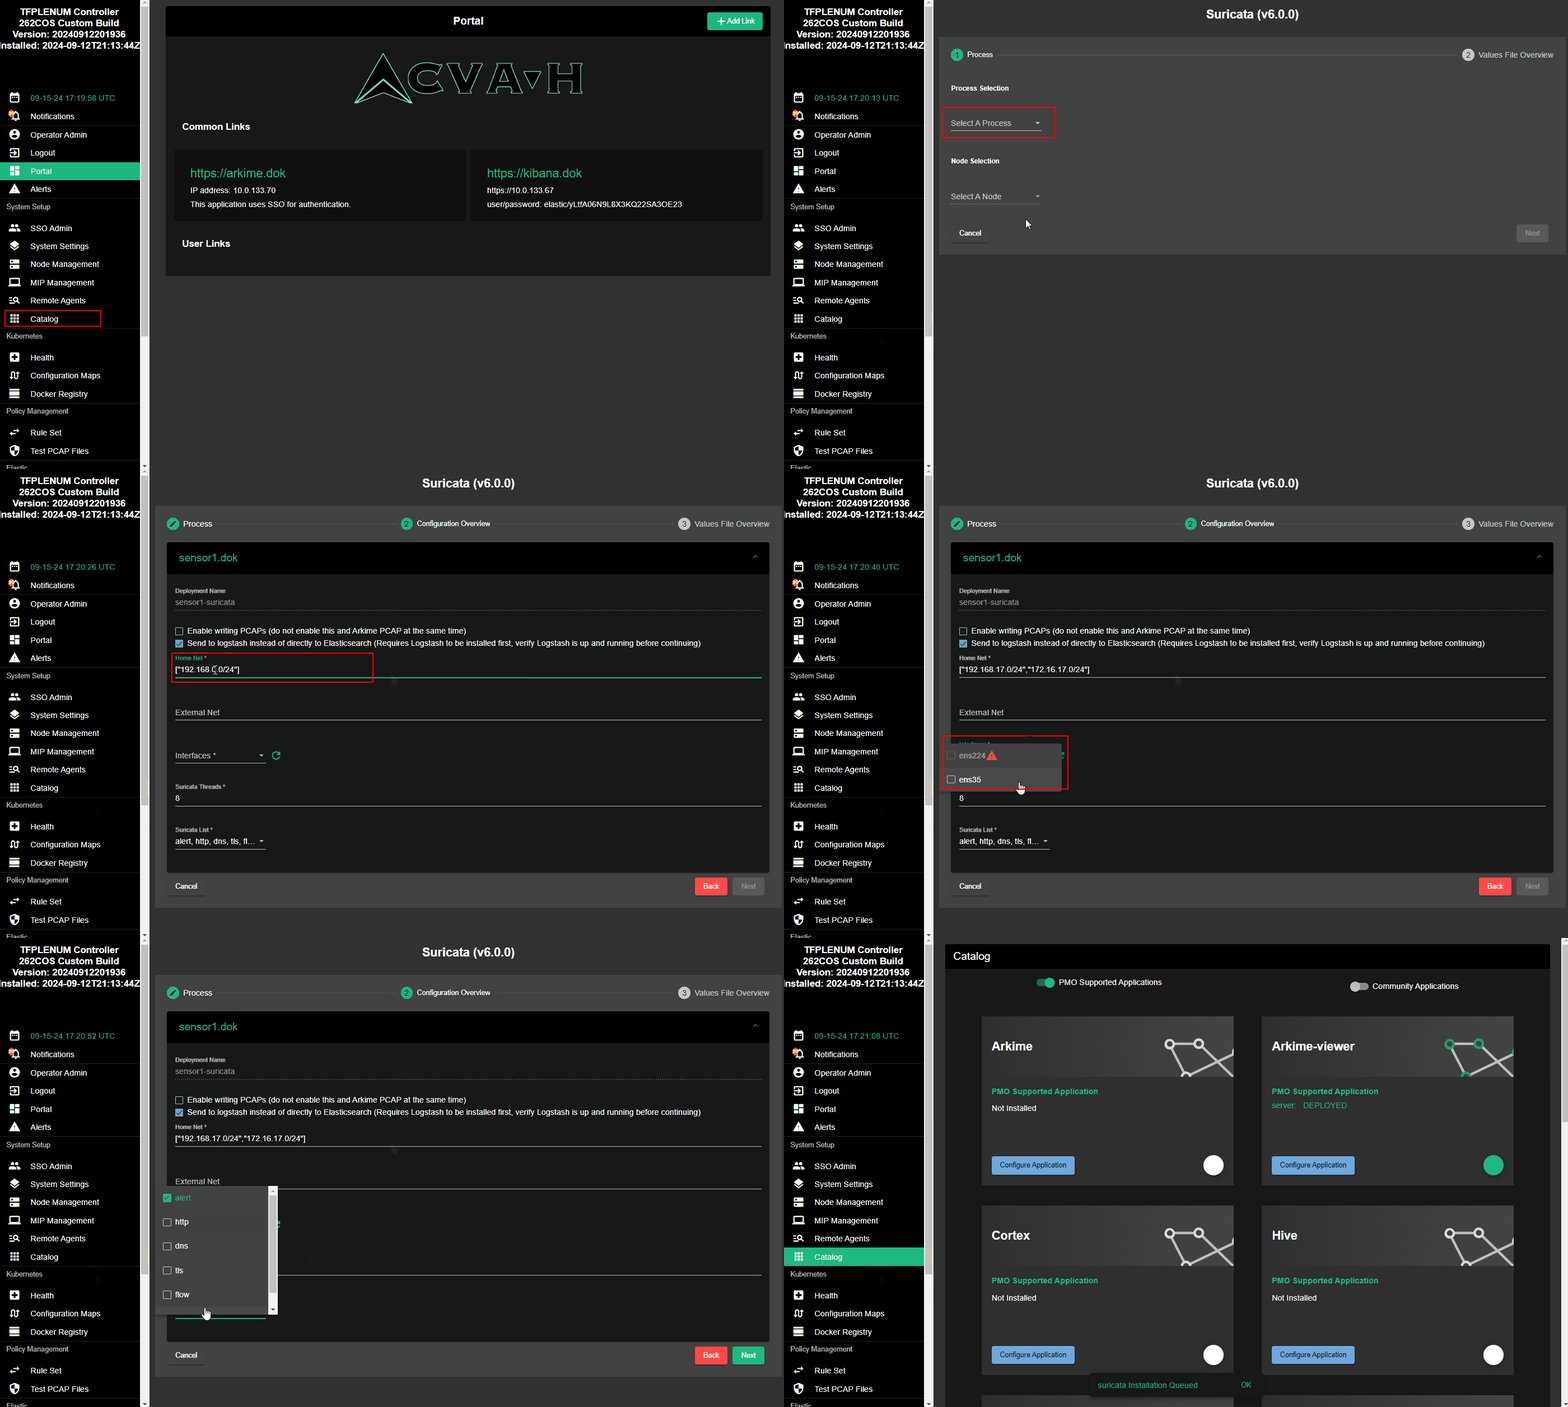
Browse to the TFPlenum Controller UI page
-
On the left navigation bar, click the Catalog link
-
Click the Configure Application button on the Suricata tile (a wizard will appear)
-
Click the Select A Process drop-down and select the Install option
-
Click Select A Node drop-down
NOTE: All configured sensors will have checkboxes next to them; select all sensors and then click Next
-
In Configuration Overview fill out the following fields for each sensor selected in the previous step
- Configure the
Home Netfield (set this to["192.168.0.0/16","172.16.0.0/12","10.0.0.0/8"]unless DAL info has been given by the requestor/MEL) - Select Interfaces drop-down (All connected network interfaces except management will appear with checkboxes)
- Select all the network interfaces monitoring traffic (i.e., Network Interfaces cards plugged into a mission partner network either through fiber or copper)
- Leave the Suricata Threads field set to
8unless the sensor it is being installed on does not have enough CPU cores (8) to support the Suricata threads - Within the Suricata List field, reduce the set to just
alertselected, as the other logs mostly duplicate data that is already produced by Zeek - Before clicking the Next button, ensure the following option is enabled:
🗹 Send to logstash instead of directly to Elasticsearch
- Configure the
3. Install Arkime Viewer
Skip this step if Arkime Viewer is already installed.
- Browse to the TFPlenum Controller UI page
- On the left navigation bar, click the Catalog link
- Click the Configuration Application button on the Arkime-viewer tile (a wizard will appear)
- Click Select A Process drop-down and select the Install option
- Click the Next button
NOTE: Leave "Install App on Service Node" selected to save space on the servers
- Click the Next button
- Review the configuration values and correct the values if necessary by clicking on the Advanced Configuration button
- Click the Run button (the screen will transition back to the main catalog screen)
4. Install Arkime
Arkime Viewer needs to be installed before installing Arkime.
-
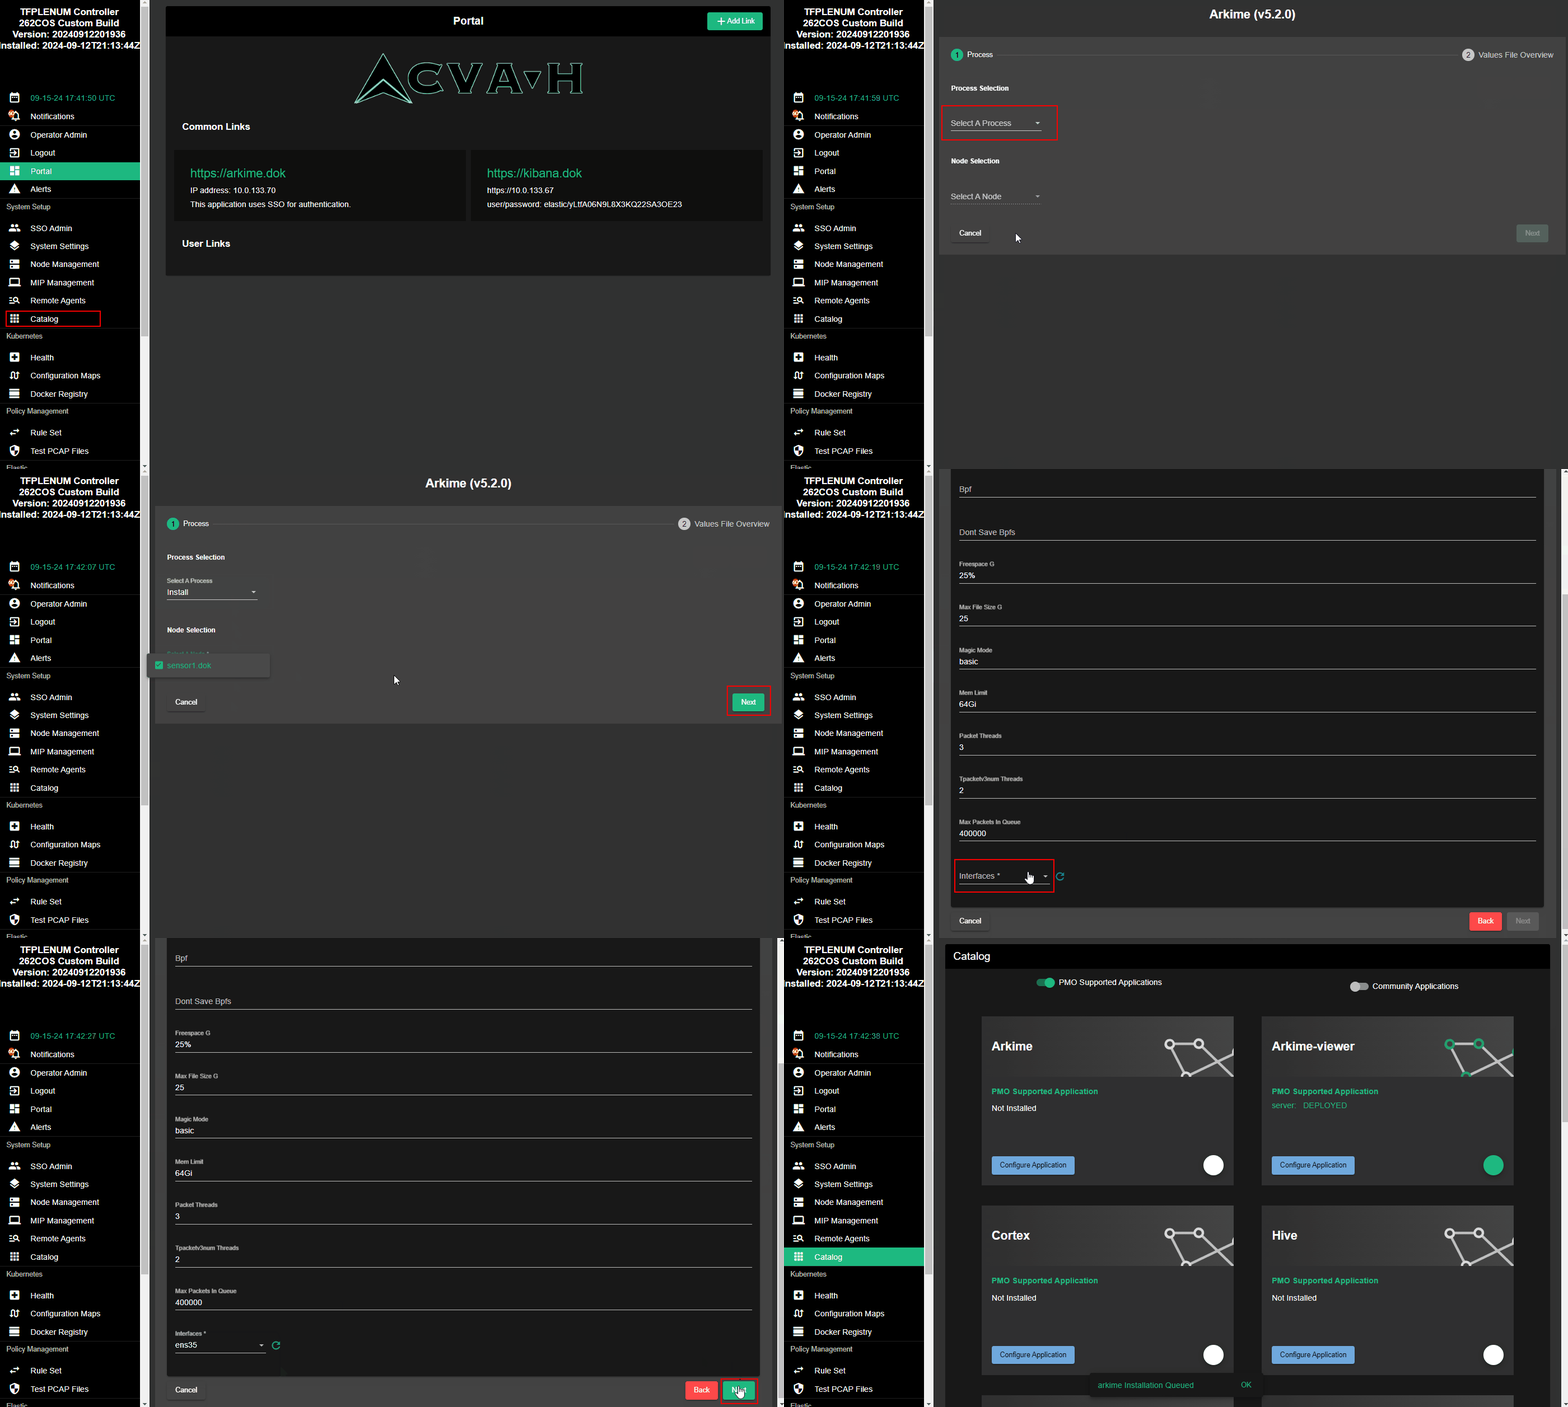
Browse to the TFPlenum Controller UI page
-
On the left navigation bar, click the Catalog link
-
Click the Configuration Application button on the Arkime tile (a wizard will appear)
-
Click Select A Process drop-down and select the Install option
-
Click the Next button
-
Click Select A Node drop-down
NOTE: All configured sensors will have checkboxes next to the configured sensors; select all sensor(s) and then click Next
-
In the Configuration Overview fill out the following fields for each Sensor selected
- Select Interfaces drop-down (All connected network interfaces except management will appear with checkboxes)
- Leave the Mem Limit field set to
64Giunless the sensor it is being installed on does not have enough memory (64GB) to support this - Leave the Packet Threads field set to
3unless the sensor it is being installed on does not have enough CPU cores (3) to support this - Select all the network interfaces monitoring traffic (i.e., Network Interfaces cards plugged into a mission partner network either through fiber or copper)
-
Click the Next button
-
Review the configuration values and correct the values if necessary by clicking on the Advanced Configuration button
-
Click the Run button (the screen will transition back to the main catalog screen)
STEP 2. Synchronize Suricata Rules
-
Browse to the TFPlenum Controller UI page
-
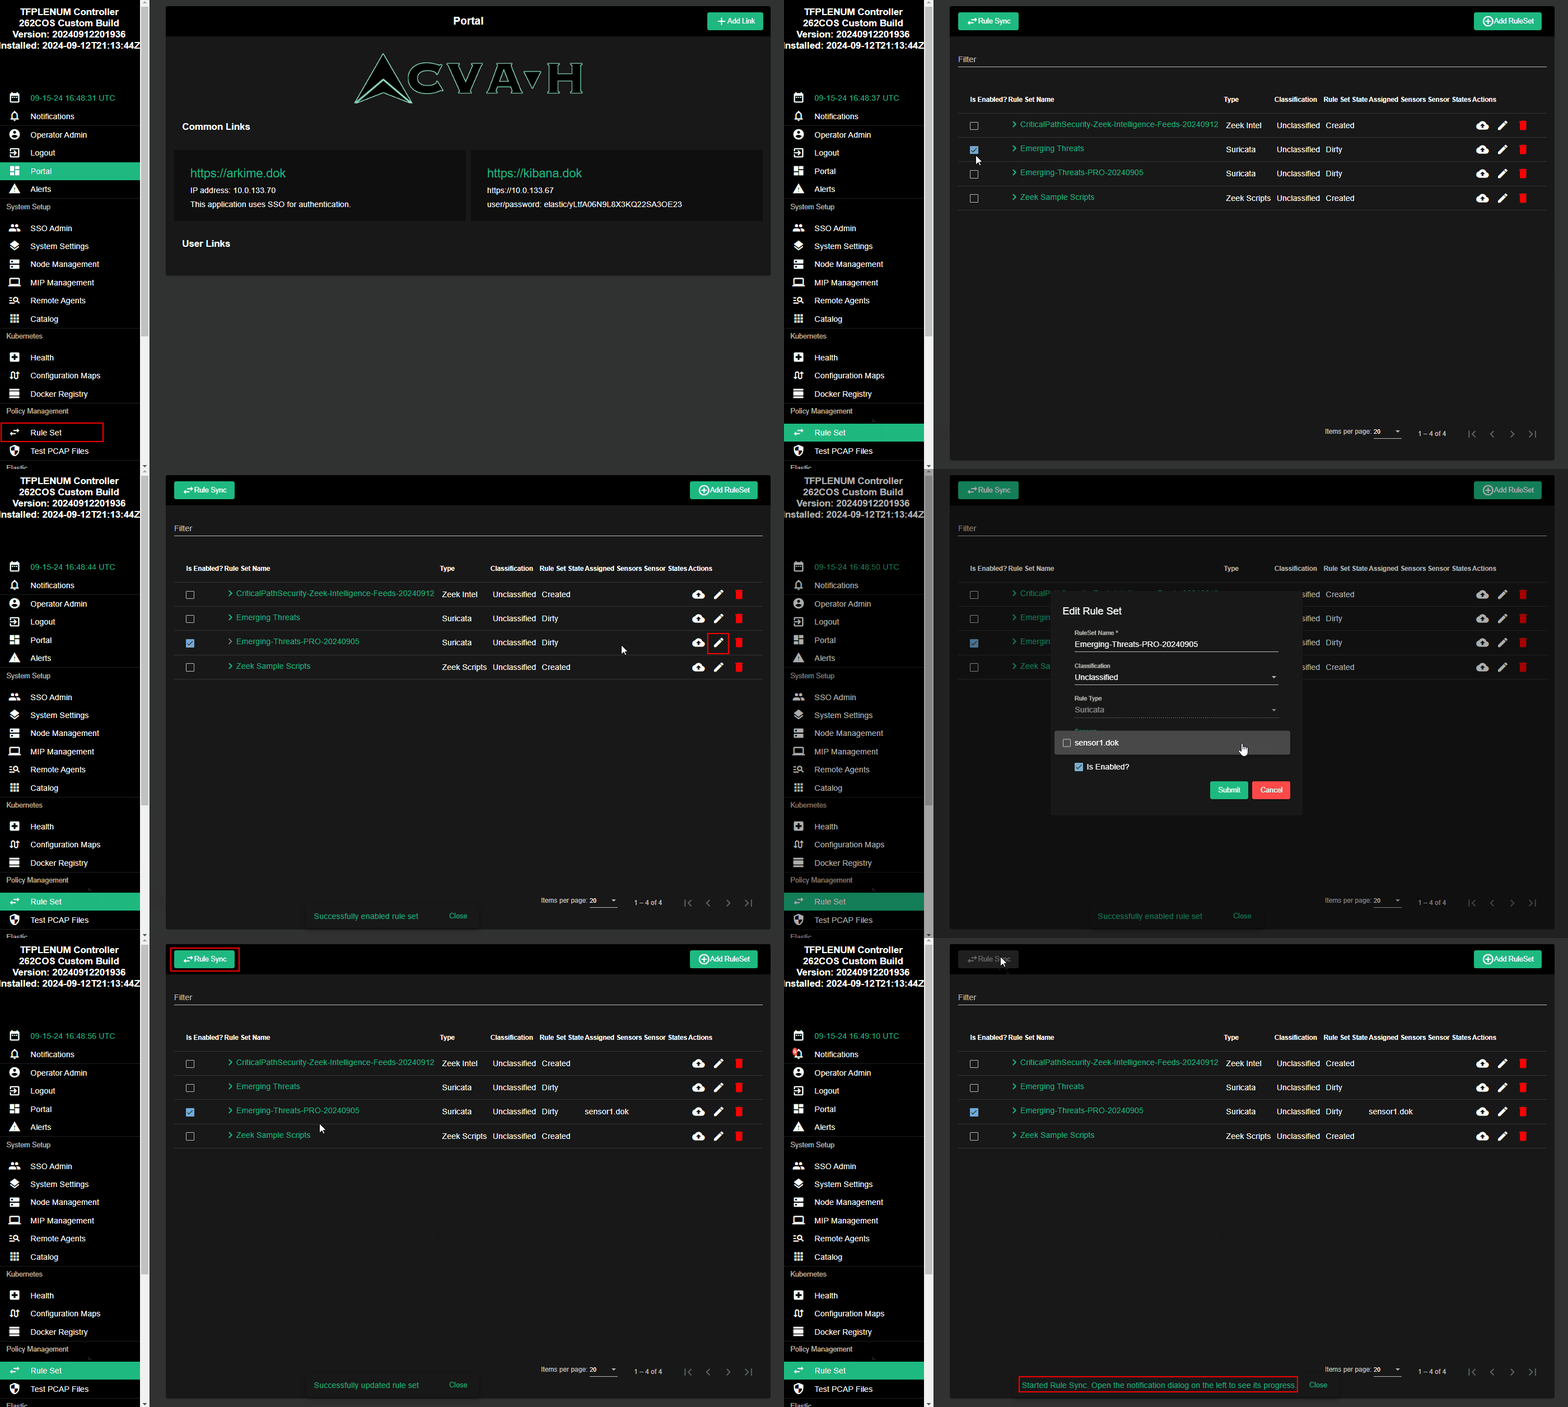
On the left navigation bar, click the Rule Set link
-
Find the Suricata ruleset you want sync with your sensors and click it's checkbox toggle to enable it
NOTE: For DIP Kits with built IAW
262COS-DIP-SOP-001, disable theEmerging Threatsruleset and enable theEmerging-Threats-PRO-*ruleset -
Click the corresponding Edit RuleSet button (pencil icon) for the Suricata ruleset you want sync, and select on the sensors you want to apply it to and click the Submit button to apply your changes
NOTE: Under the Assigned Sensors column, you will see all the sensors that the ruleset is applied to appear - if there is nothing in the column, then the ruleset may be enabled but not applied to any sensors
-
Click the Rule Sync button in the top-left corner to apply the rules immediately
-
Verify that the rules have synchronized by clicking the Health link in the left navigation bar:
- Under the Pods section, find a sensor node that you apply the rules to and expand it to see all of it's Kubernetes pods
- Find a
sensor#-suricata-*pod (notsensor#-suricata-filebeat-*) and click the?button to view pod logs - Switch to the
suricatatab to view Suricata's logs - Verify that there is a log entry showing that at least one file was loaded and that there were rules within the file, which should look similiar to the following:
<Info> - 1 rule files processed. 72228 rules successfully loaded, 0 rules failed
NOTE: If there are no logs within the window, then close and re-open the window by clicking the?button to view pod logs again until the logs appear for thesuricatatabSuricata Rule Sync Failures - Manual FixOccasionally you will encounter a failed rule sync, were the following log message will be displayed:
<Warning> - [ERRCODE: SC_ERR_NO_RULES_LOADED(43)] - 1 rule files specified, but no rules were loaded!In order to manually remedy this, you can either reattempt the Rule Sync button or perform the following procedures:
- Transfer the Suricata rule files you want to sync to the controller
NOTE: For DIP Kits with built IAW
262COS-DIP-SOP-001, you can find the rules on the Fileserver atsmb://fileserver/share/ANALYTICS/02_SURICATA/RULES - SSH into the controller as
rootand execute the following commands
# Concatenate all suricata rules into a single file
cat "./<RULES_FOLDER>/*.rules" > ./suricata.rules
# Find all registered DIP Sensors via the Contoller's API
API_TOKEN_REQUEST='/opt/tfplenum/.venv/bin/python3 /opt/sso-idp/gen_api_token.py --roles controller-admin --exp 0.1'
DIP_SENSORS=$(curl -s -k -X GET -H "Authorization: Bearer $($API_TOKEN_REQUEST)" https://localhost/api/kit/nodes  | /usr/bin/jq -r '.[] | select(.node_type=="Sensor") | .hostname')
# Loop through ans SCP the Suricata rules to each sensor
for DIP_SENSOR in ${DIP_SENSORS[@]}; do
scp -o "UserKnownHostsFile=/dev/null" -o "StrictHostKeyChecking=no" -o "LogLevel=error" ${DIP_SENSOR} ./suricata.rules /opt/tfplenum/suricata/rules/suricata.rules
done
# Delete all Soricata pods to restart them
kubectl delete pod $(kubectl get pods  | grep -P 'suricata-(?!filebeat)' | awk '{print $1}')